
Matplotlib 散点图
大约 2 分钟PythonPythonMatplotlib
Matplotlib 散点图
散点图(Scatter Plot) 是一种常用的统计图表,用于展示两个变量之间的关系。每个数据点在二维坐标系中表示为一个点,横轴和纵轴分别代表两个不同的变量。散点图非常适合用于发现变量之间的相关性、趋势以及异常值。
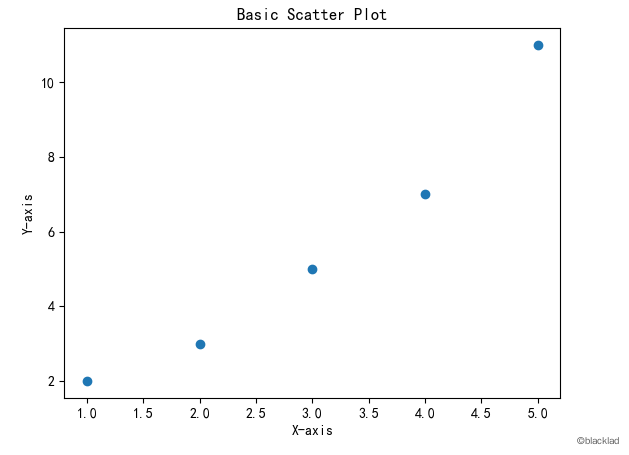
1 简单散点图
在 Matplotlib 中,使用 scatter 函数可以轻松创建散点图。
import matplotlib.pyplot as plt

# 数据
x = [1, 2, 3, 4, 5]
y = [2, 3, 5, 7, 11]

# 创建散点图
plt.scatter(x, y)

# 添加标题和标签
plt.title('Basic Scatter Plot')
plt.xlabel('X-axis')
plt.ylabel('Y-axis')

# 显示图表
plt.show()
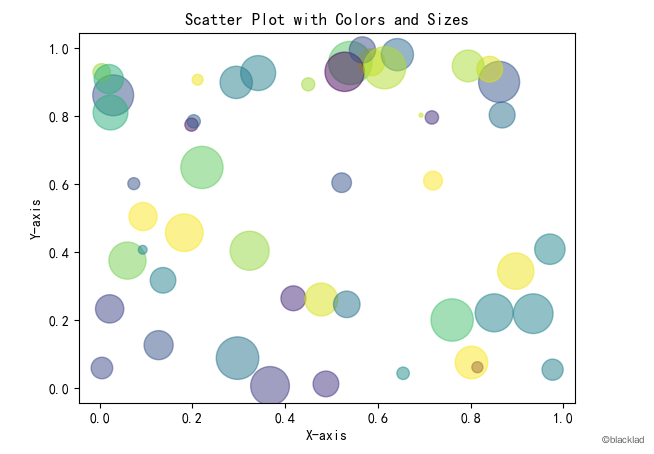
2 设置参数
import matplotlib.pyplot as plt
import numpy as np

# 数据
x = np.random.rand(50)
y = np.random.rand(50)
colors = np.random.rand(50)
sizes = 1000 * np.random.rand(50)

# 创建散点图
plt.scatter(x, y, c=colors, s=sizes, alpha=0.5)

# 添加标题和标签
plt.title('Scatter Plot with Colors and Sizes')
plt.xlabel('X-axis')
plt.ylabel('Y-axis')

# 显示图表
plt.show()
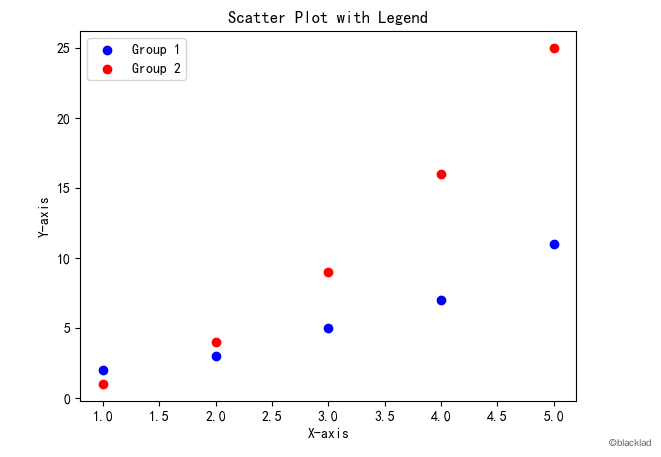
3 添加图例
import matplotlib.pyplot as plt

# 数据
x1 = [1, 2, 3, 4, 5]
y1 = [2, 3, 5, 7, 11]
x2 = [1, 2, 3, 4, 5]
y2 = [1, 4, 9, 16, 25]

# 创建散点图
plt.scatter(x1, y1, c='blue', label='Group 1')
plt.scatter(x2, y2, c='red', label='Group 2')

# 添加标题和标签
plt.title('Scatter Plot with Legend')
plt.xlabel('X-axis')
plt.ylabel('Y-axis')

# 添加图例
plt.legend()

# 显示图表
plt.show()
4 常用参数
scatter 函数的一些常用参数:
- x: 横轴数据,通常是第一个变量。
- y: 纵轴数据,通常是第二个变量。
- c: 颜色,可以是单一颜色或颜色数组。
- s: 点的大小,可以是单一大小或大小数组。
- marker: 点的形状,常见的有圆形('o')、方形('s')、三角形('^')等。
- alpha: 透明度,取值范围从 0(完全透明)到 1(完全不透明)。
- label: 图例标签,用于图例说明。