Matplotlib 介绍
小于 1 分钟PythonPythonMatplotlib
Matplotlib 介绍
Matplotlib 是一个用于创建高质量图表的 Python 绘图库。它是由 John Hunter 在 2002 年创建的,并且已经成为科学计算领域中非常流行的工具之一。Matplotlib 可以用来生成各种静态、动态、交互式的可视化图表,包括线形图、直方图、散点图、等高线图、热力图等。
安装
Python 环境需要使用 pip 命令安装
pip install matplotlib
使用
导入方式
import matplotlib.pyplot as plt
在 jupyter 中需要设置
%matplotlib inline
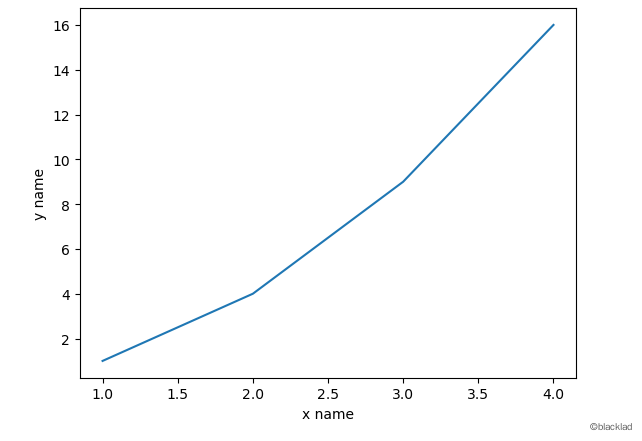
展示折线图
# 画的坐标
plt.plot([1,2,3],[1,4,9])

# 设置横坐标轴名称
plt.xlabel("x name")
# 设置纵坐标轴名称
plt.ylabel("y name")

plt.show()