
Matplotlib 风格
小于 1 分钟PythonPythonMatplotlib
风格
1 风格设置
在使用 Matplotlib 绘制图表时,可以通过 plt.style 模块来改变图表的整体外观样式。Matplotlib 提供了多种预定义的样式表,这些样式表可以改变线条的颜色、宽度、背景颜色等属性,使图表更加美观。
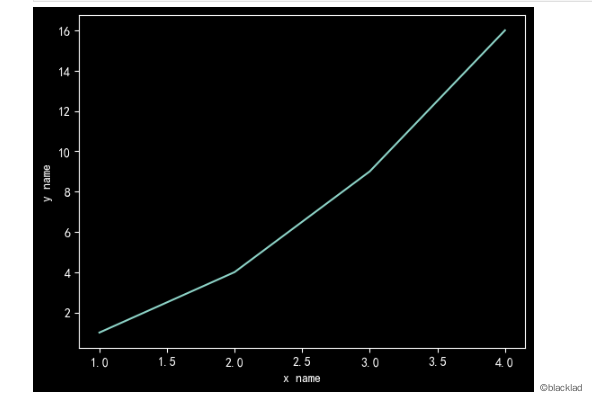
# 画的坐标
plt.plot([1,2,3,4],[1,4,9,16])

# 设置横坐标轴名称
plt.xlabel("x name")
# 设置纵坐标轴名称
plt.ylabel("y name")

plt.style.use('dark_background')
plt.show()
2 可用的样式
可以查看当前环境支持的所有可用的样式
print(plt.style.available)
['Solarize_Light2', '_classic_test_patch', '_mpl-gallery', '_mpl-gallery-nogrid', 'bmh', 'classic', 'dark_background', 'fast', 'fivethirtyeight', 'ggplot', 'grayscale', 'seaborn-v0_8', 'seaborn-v0_8-bright', 'seaborn-v0_8-colorblind', 'seaborn-v0_8-dark', 'seaborn-v0_8-dark-palette', 'seaborn-v0_8-darkgrid', 'seaborn-v0_8-deep', 'seaborn-v0_8-muted', 'seaborn-v0_8-notebook', 'seaborn-v0_8-paper', 'seaborn-v0_8-pastel', 'seaborn-v0_8-poster', 'seaborn-v0_8-talk', 'seaborn-v0_8-ticks', 'seaborn-v0_8-white', 'seaborn-v0_8-whitegrid', 'tableau-colorblind10']